Methodology
Emissions Factors
Results
Emission estimation methodology
Ships, during the time they remain moored in port, obtain the energy they need for
- movement ramps inside the hold
- refrigeration of perishable goods containers
- air conditioning of the passage
- interior lighting
- others
, by generators powered by auxiliary combustion engines feed on fossil fuels.
This methodology is applicable to greenhouse gases emission estimation, that is, mainly to CO2 emissions. Exhaust gases and particles emissions are also estimated. This pollutants affect air quality in port cities and harm the health of the inhabitants living near the docks.
The objective of supplying energy directly from the general electric grid is to eliminate ships contribution to air pollution in cities.
In addition, supplying energy through an OPS facility can contribute to transport decarbonization, given that the electric grid allows to use energy generated by renewable sources. Both Spain, the EU and the rest of the International Community has made commitment to reduce global warming, and this necessarily passes through increase the renewable energy consumption.
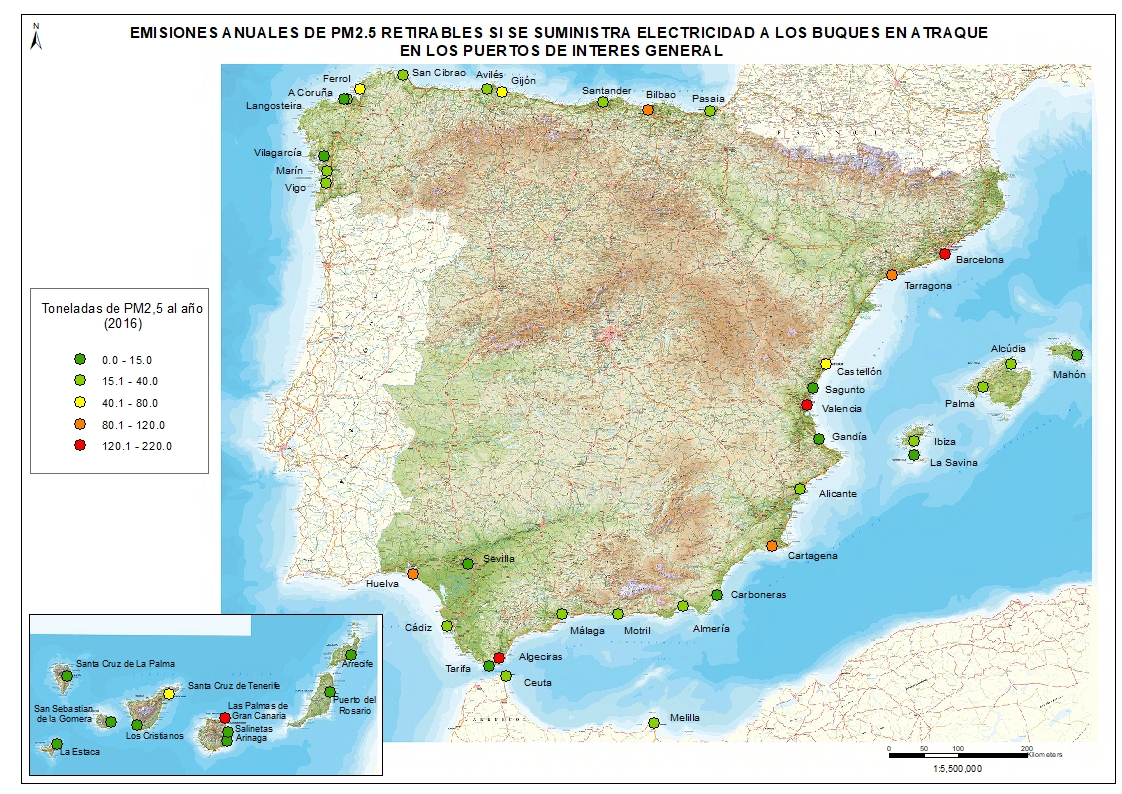
The methodology applied for estimating CO2 emissions is described in the document IMO Inventories of emissions of GHGs and other relevant substances (Third IMO Greenhouse Gas Study 2014). Results are presented as pollutant emission maps
a) DATA SOURCE AND TYPE
Data required to elaborate the maps of CO2 and pollutant emitted by ships at berth are the following:
-
-
Vessel stay data: number of hours the ship stood moored during 2016.
-
Ships size (this data is used in different units depending in the vessel type): Gross Tonnage (GT), DWT, length or TEU.
-
Vessel type: as from this data, together with ship size, auxiliary engine power can be estimated using the tables published at the 3rd IMO Study on GHG, 2014.
-
These data has been provided by the OPPE and MARINE TRAFFIC, both consortium partners.
b) EQUATION USED FOR EMISSION CALCULATION
Once auxiliary engine power and stay hours are known, the emissions can be calculated for different exhaust gases using the equation below:
Ei = AE * t * FEi
E i pollutant emissions (pollutant tonnes)
AE auxiliary engine power (kW)
t time (horas)
FE i pollutant emission factor (t/kWh)
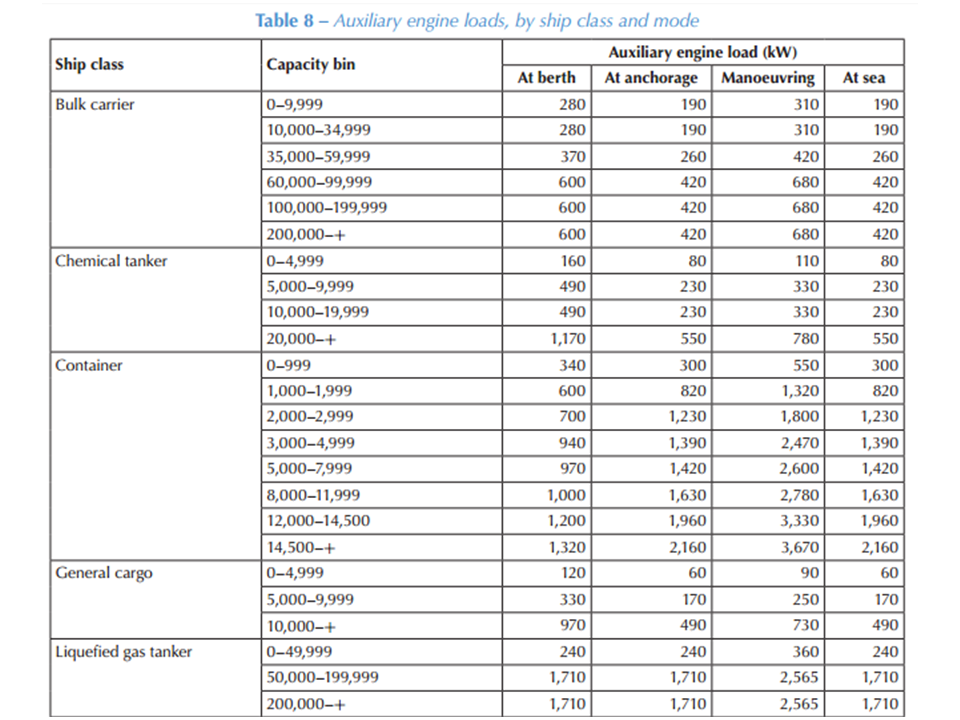
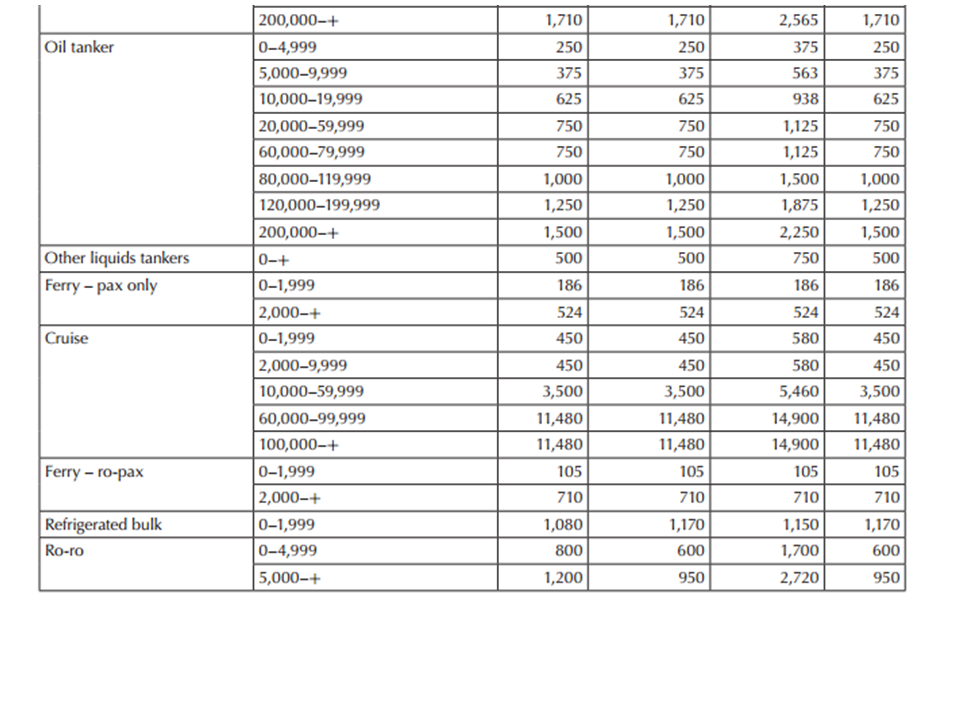
Auxiliary engine power can be estimated using Bin system. Bin is a unit of size or freight capacity measured in GT, DWT, TEU, cm3 or length. Depending on the fleet or the type of ship considered a specific bin is used; as is established in the document “IMO GHG and other relevant substances Emissions Inventory Anex I” (3rd IMO Study on GHG, 2014).
In Table 8 of the above mentioned Annex I auxiliary engine power is specified based on the vessel type, bin and ship activity: at berth, at anchorage, manoeuvring and at sea.
Emission Factors used
The emission factors listed below have been obtained from two sources:
-
EMEP/EEA air pollutant emission inventory guidebook 2016 IMO (EEA).
-
Energy Demand and Exhaust Gas Emissions of Marine Engines. Technical University of Denmark (TUD).
, and assuming three hypotheses:
-
Auxiliary engine are feed with MDO/MGO fuel (not with HFO)
-
Auxiliary engine achieve Tier II regarding NOx
-
Auxiliary enginge are “medium-speed diesel” type
Pollutant |
Emission Factor (kg/kg) |
Emission Factor (kg/kWh) |
|---|---|---|
CO2 |
3,15 kg/kgaverage value of those proposed by EEA y TUD |
707 gr/kWha bit above the value, 609 gr/kWh, proposed specifically for auxiliaries engines by TUD |
SOx |
2,1 gr/kgTUD: gr SOx/kg of fuel = 21 % by mass of S in fuel |
0,42 gr/kWhaverage value between UCA 4,3 gr/kWh and TUD 3,99 gr/kWh |
NOx |
86,5 kg/ton (EEA) |
9,6 gr/kWhproposed specifically for auxiliaries engines by TUD below the 13 or 10 gr/kWh proposed by EEA specifically for auxiliaries engines for Tier II |
PM10 |
1,6 kg/ton (EEA) |
0,32 gr/kWh |
PM2,5 |
1,5 kg/ton (EEA) |
0,3 gr/kWh |
Results
| Total Emissions |
CO2 (T) |
NOX (T) |
SOX (T) |
PM10 (T) |
PM2,5 (T) |
|---|---|---|---|---|---|
Spanish ports in 2016 |
835.665,9 |
11.347,1 |
496,4 |
378,2 |
354,6 |
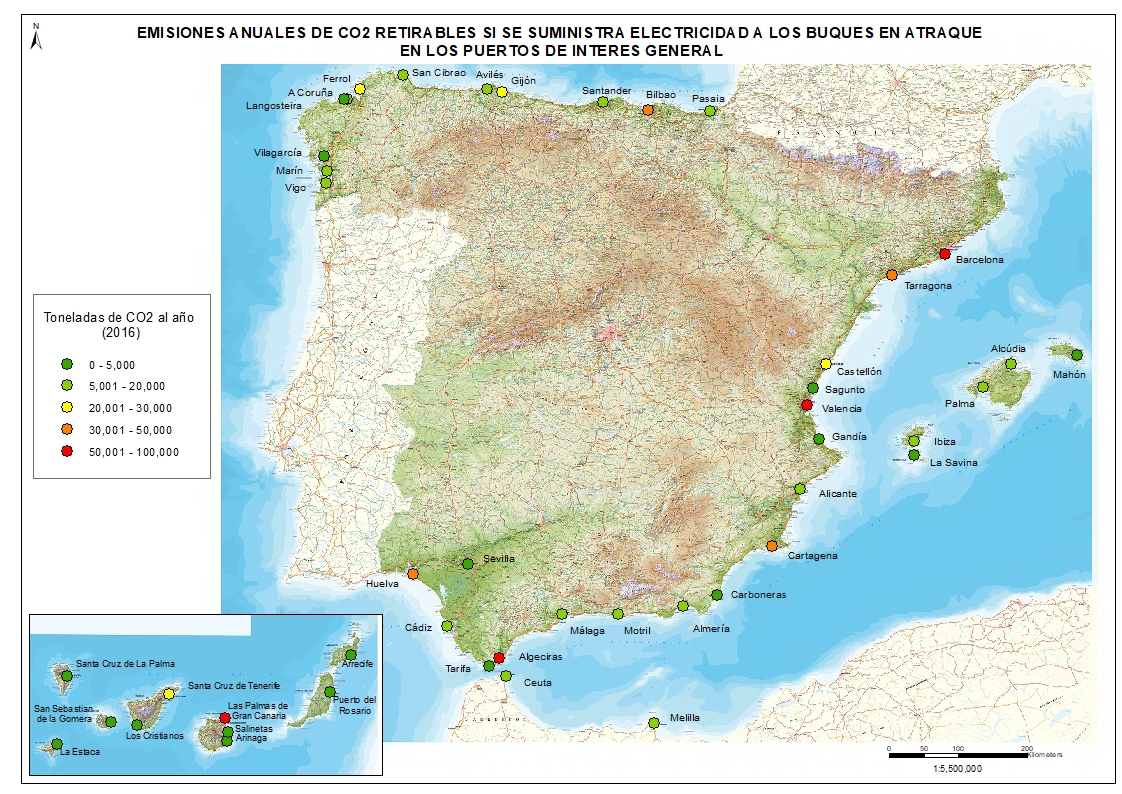
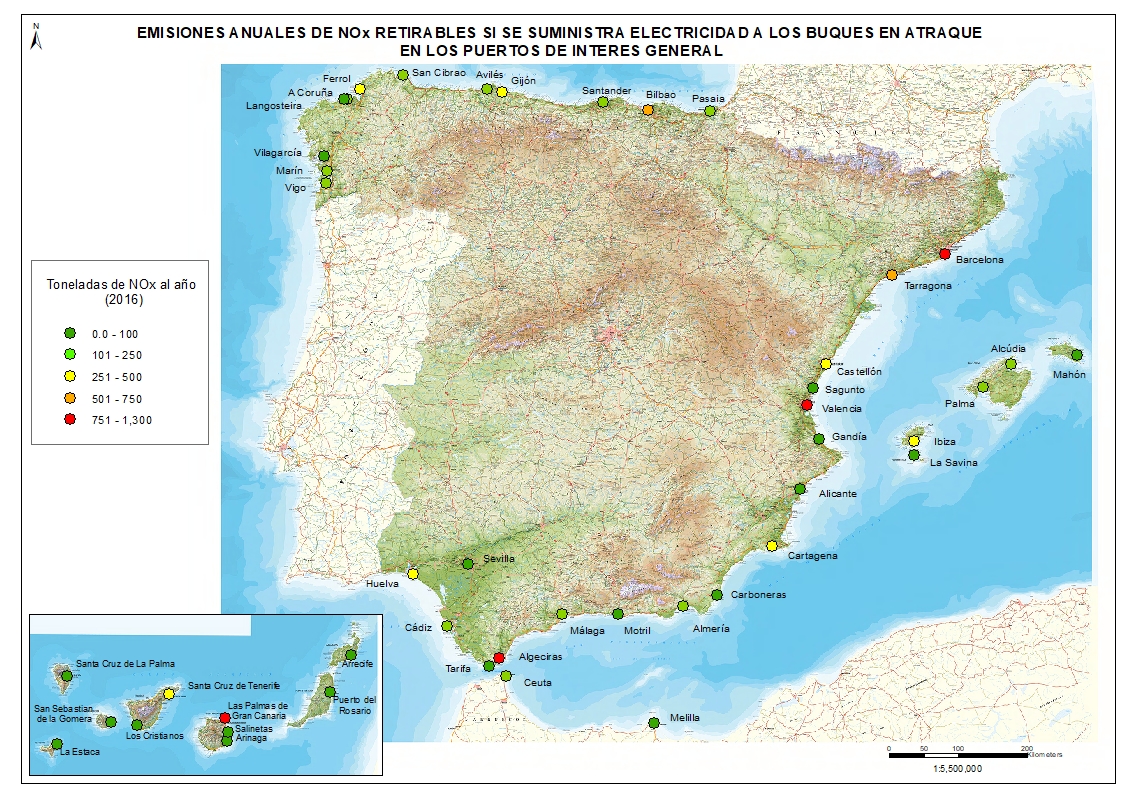
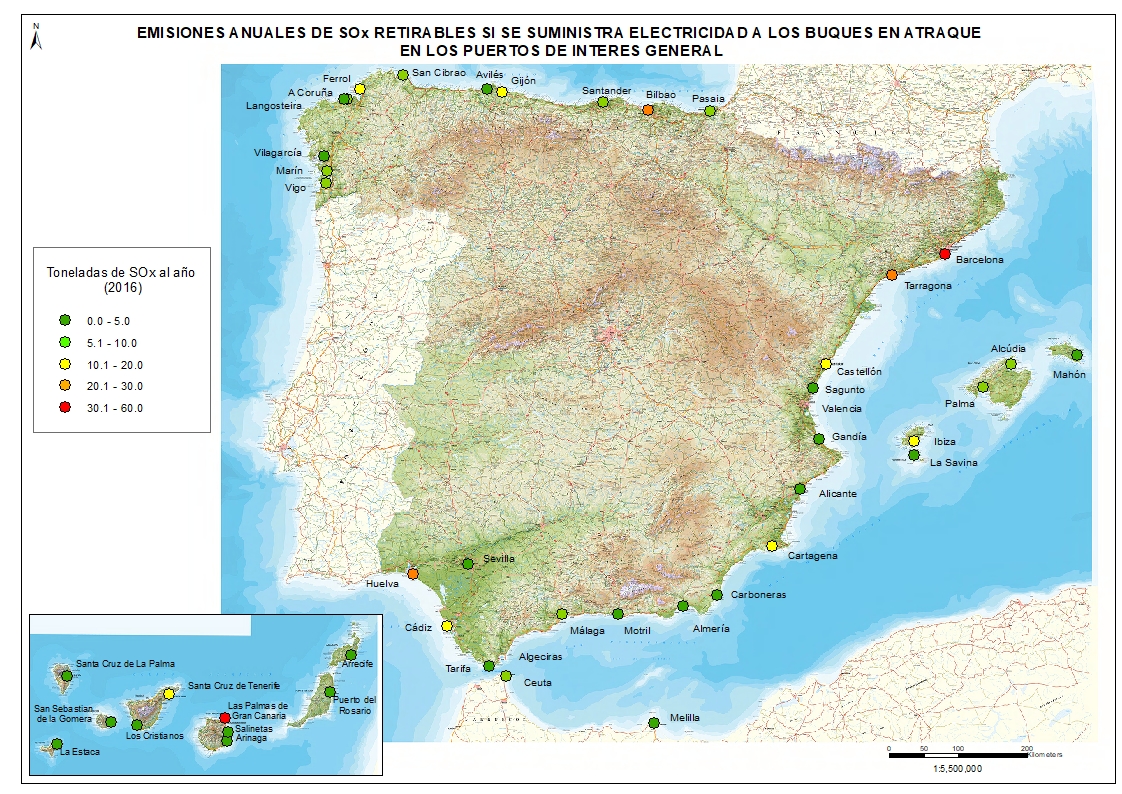
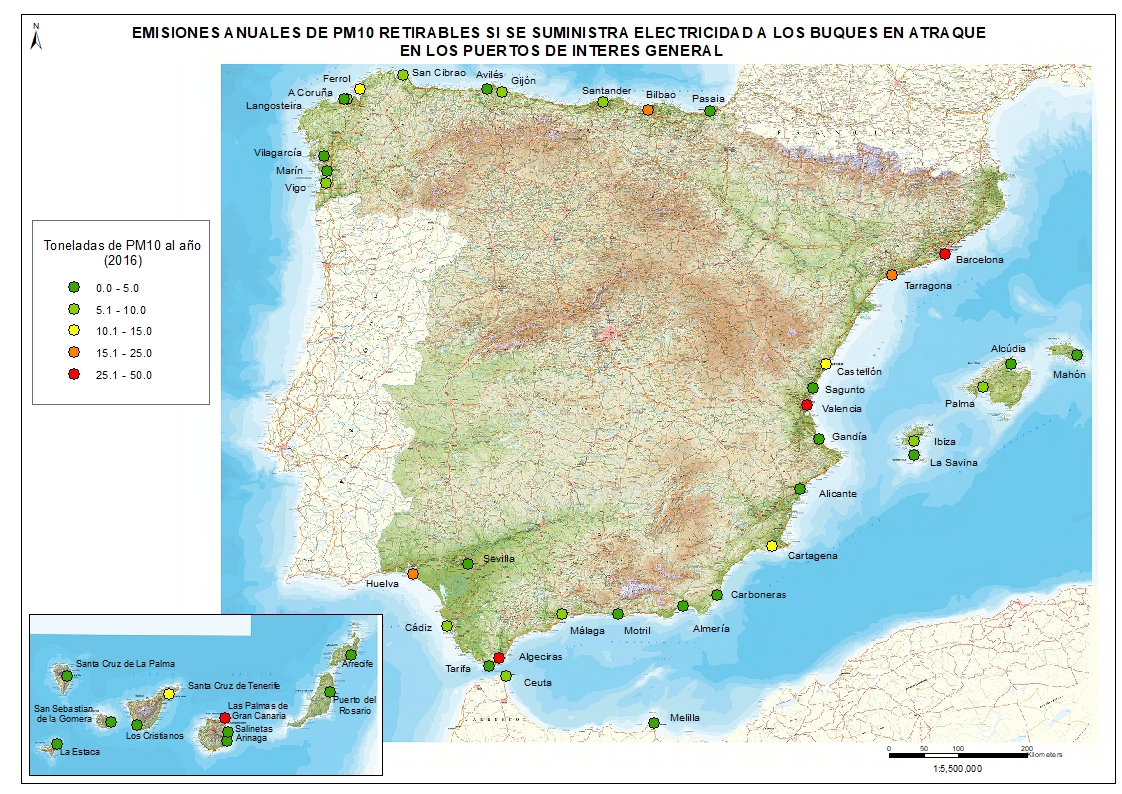
CO2, NO2, SOx, PM10 and PM2,5 annual tons that could be removed of the atmosphere in case ships at berth were be supplied with energy from the onshore electric grid in the Spanish Ports of Interest.


